Land-surveying and GIS
What is land surveying?
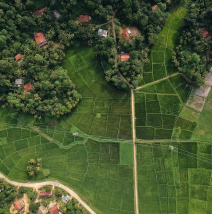
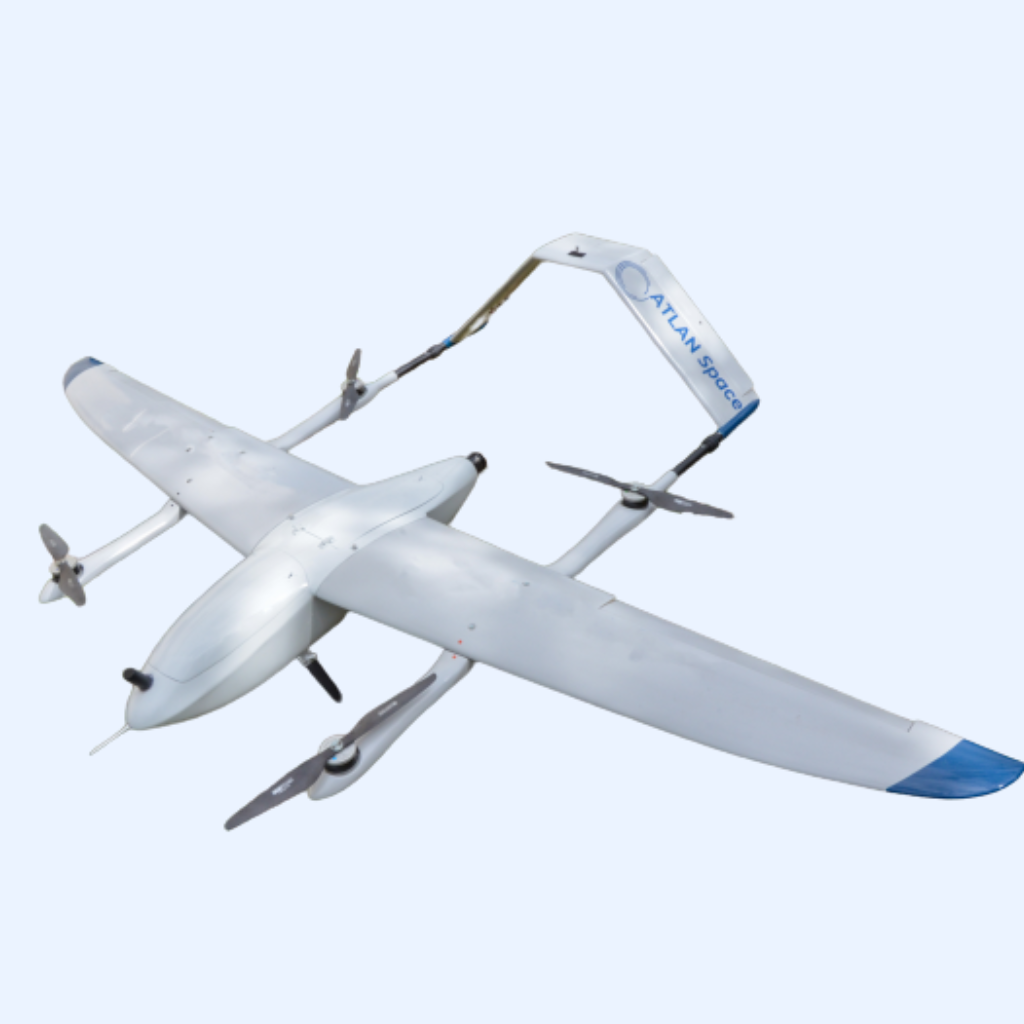
Aerial surveying is a technique used to collect data about the earth’s surface by flying an unmanned aerial vehicle (UAV), the latter is usually equipped with advanced sensors, cameras, and GPS systems that allow for the creation of detailed and accurate maps and surveys in a fraction of the time it would take using traditional methods.
UAVs perform the mission quickly and efficiently, collecting data from multiple angles and heights. This provides a more comprehensive understanding of the landscape, including topographical features and vegetation patterns. The data collected by drones is used to create detailed maps, 3D models, and orthophotos, which can be used for a variety of purposes, such as land development, mining, construction, and environmental monitoring.
What is GIS?
It’s widely used across multiple industries such as urban planning, environmental management, transportation, and public health. For example, city planners use GIS to optimize transportation networks, emergency responders utilize it to find the fastest routes during crises, and environmentalists rely on it to monitor deforestation and habitat changes. GIS is essential for informed decision-making and fostering sustainable growth.
Why choose drones for land surveying?
The use of drones for mapping and land surveying is also cost-effective. Traditional surveying methods require a significant investment in equipment and personnel, while drone technology has become more accessible and affordable in recent years. Additionally, the reduced time and effort required to complete projects using drones means that overall costs can be significantly reduced.
What are the expected data outputs of using drone surveying?
The deliverables depend on the drone itself, its payload, and sensors, your mission requirements as well as your post-processing software (Note that ATLAN Geo is compatible with most post-processing softwares including Pix4d, ODM, ArcGIS..).
Data outputs include but are not limited to:

Orthomosaic Raster
An orthomosaic map is a two-dimensional composite aerial image created from multiple overlapping drone-captured images called orthophotos that have been corrected so that the scale to the earth’s actual surface is uniform throughout the deliverable. It is usually georeferenced and accurately aligned to create a seamless, high-resolution map of an area. The orthomosaic map can be used for various applications such as land surveying, agriculture, urban planning, and construction…


3D point cloud
A 3D point cloud is a set of data points in three-dimensional space. It is composed of points that are defined by their x, y, and z coordinates, along with additional data such as color, intensity, or range. When transformed into pixels and placed together to form a “cloud,” these points provide a rough outline of the surveyed area.
It is typically used to measure distance, objects, areas and volumes in terms of depth, height and much more.


3D textured mesh
A textured 3D model is a 3D mesh that is made up of a set of connected triangular polygons or faces that have a texture (the surveyed terrain’s visual presentation) applied to its surface (the surveyed area’s shape) to add more detail and realism. This texture can be a photograph, a pattern, or any other type of image that is mapped to the 3D model’s surface.
Using 3D models is advantageous when planning large-scale building ventures that involve many stakeholders. It ensures that data is easily accessible to all parties involved.


Contour lines
Contour lines are an intricate network of mapped lines used to illustrate the shape, elevation, and landforms of an area, with each line representing an elevation change such as sea level or the height of a mountain. They are typically shown in brown or black, with heavier lines representing higher elevations.
They typically form a series of concentric circles running from the highest point of the terrain to the lowest and are created by connecting points of equal elevation on a topographic map, creating a 3-dimensional map of the terrain. They can be used to measure the slope and size of a mountain, valley, or other terrain.


Cadastre maps
Cadastre maps are 2D property maps that show the boundaries and features of a particular piece of land, including natural features such as hills, valleys, rivers and streams, as well as man-made features such as roads, fences, and buildings. These maps are often used for legal purposes such as taxation and land use planning, as well as for research purposes and urban planning.
They may also be used to identify land ownership and to document land use rights. For example, a cadastre map might be used to identify boundary lines between properties or support property disputes, as they provide information that is useful in determining ownership and other legal rights.


Digital elevation models (DEM)
Digital elevation models (DEM) are digital representations of elevation data of a physical landscape, usually in the form of a three-dimensional array of evenly spaced points that represent the terrain heights. The data used to create DEMs includes elevation points taken from satellite imagery, aerial photographs, and other sources.
DEMs are typically used in geographic information systems (GIS) to create maps and analyze land use, they are also used for environmental modeling, urban planning, and 3D visualization. Note that these models are essentially surfaces that do not contain texture data or color, the latter is in fact used to show elevation differences.
Similar Articles
Atlan update brings first-ever safe RTH and more
Lorem ipsum dolor sit amet consectetur. Duis libero et lorem morbi eget commodo et elementum mi. Auctor interdum egestas phasellus.


Atlan update brings first-ever safe RTH and more
Lorem ipsum dolor sit amet consectetur. Duis libero et lorem morbi eget commodo et elementum mi. Auctor interdum egestas phasellus.


Atlan update brings first-ever safe RTH and more
Lorem ipsum dolor sit amet consectetur. Duis libero et lorem morbi eget commodo et elementum mi. Auctor interdum egestas phasellus.


Atlan update brings first-ever safe RTH and more
Lorem ipsum dolor sit amet consectetur. Duis libero et lorem morbi eget commodo et elementum mi. Auctor interdum egestas phasellus.
Automatic Sense and Avoid for Remotely Piloted Aircraft Systems (RPAS)


Please fill form to download whitepapers
Your operators will know how to deploy
ATLAN GEO in just a few days of online training
Get in touch with us
Contact ATLAN Space to :
Stay up to date
Subscribe to newsletter for latest news & updates.
ATLAN Space Solutions
About us
- Company
- Contact Us
- Become A Distributor
- Press Media/Kits
- Warranty
Industry solutions
- Land-Surveying & GIS
- Mining & Exploration
- Ocean Monitoring
- Agriculture
- Oil And Gaz
- Environment & Disaster Assessment
- Construction & Infrastructure
- Cargo Delivery
Knowledge Base
- Resource
- News & Events
- White Papers
- Blogs
- Webinars
- Privacy Policy
- Copyright © 2023 Atlan Space All rights reserved.


